

What the hell is a Yield curve?
What the hell is a Yield curve?
And why would anyone want to control it?


Today, we thought we would address a concept that recent financial news has substantially focused on - ‘yield curves’. More specifically, the Federal Reserve (Fed) - the central bank of US, has been hinting at something called ‘yield curve controls (YCC)’, which has in turn fuelled concerns over the shape and slope of the yield curve. One can, in fact, see various investors and stakeholders actively placing bets on the stock market in anticipation of the YCC policy.
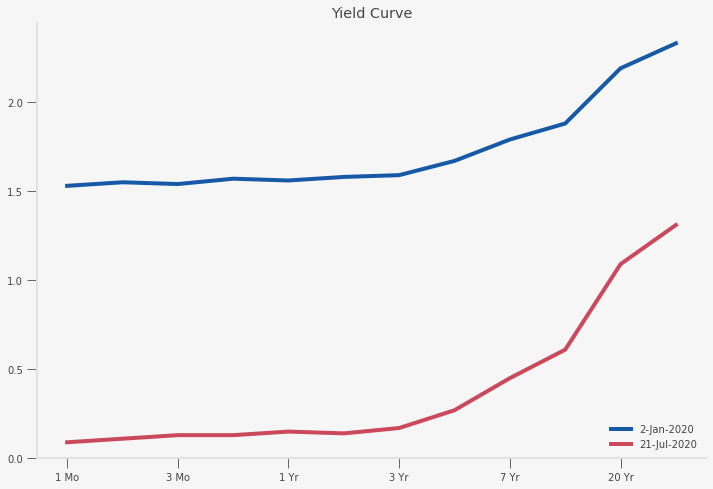
Here’s a quick refresher on what these economic terms mean. The ‘yield’ on a bond refers to the interest rate that one receives when a bond matures. The ‘yield curve’ is a visual representation of the yields on bonds of different maturities. Typically, if expectations about the future are optimistic which literally means that people anticipate higher growth and positive inflation, then, the yield curve will be upward sloping (see figure 1). This indicates that bonds with longer maturities have higher yields than short-term bonds.
Now what does one mean when they say that the yield curve is steep? From figure 1 it is obvious that the long-term bonds, as can be seen on the steeper red line, have a much higher yield than short-term rates. This difference between the rates is known as the ‘spread’ and a steeper yield curve essentially refers to a larger spread. If investors expect a higher inflation in the future which means that long-term bonds could lose value over time then, investors will hold these bonds only if interest rates are sufficiently high or more precisely if the spread is sufficiently large.
Figure 1: US Yield curve for bonds of different maturities on Jan 2, 2020 and July 21, 2020, Source: Treasury, US Government
On the other hand, an inverted (downward-sloping) yield curve signals the approach of a recession. This higher short-term rate relative to the longer one suggests that investors are skeptical about the near future and anticipate a slump. Then, investors will demand more of the less risky long-term bonds since short-term bonds are now perceived to be much riskier. This higher demand for long-term bonds will result in its lower yield and thus in the inverted shape. (If there is a high demand for a bond, like any good, its price will increase. In the context of a bond, higher bond prices are equivalent to having lower yields.)
We are winning, big time, against China. Companies & jobs are fleeing. Prices to us have not gone up, and in some cases, have come down. China is not our problem, though Hong Kong is not helping. Our problem is with the Fed. Raised too much & too fast. Now too slow to cut......Spread is way too much as other countries say THANK YOU to clueless Jay Powell and the Federal Reserve. Germany, and many others, are playing the game! CRAZY INVERTED YIELD CURVE! We should easily be reaping big Rewards & Gains, but the Fed is holding us back. We will Win!Take Trump’s tweets on the inverted yield curve for instance. In August 2019, the President’s strong stance on trade policies with China was accompanied by an inversion of the yield curve. In response to his opponents’ claims that his policies are causing the upcoming downturn, Trump, insinuated (as seen in his tweets) that the fault lay in the slow response of the Fed. His tweets clearly show that he believes that the Fed should decrease rates at a faster pace to revert the yield curve. In other words, any potential slowdown in the economy should be prevented by the Fed’s monetary policies.
Now going back to the issue of the YCC, recent news articles have highlighted two seemingly contradictory but true facts: (1) yields on all bonds, particularly long-term bonds are at an all time low and; (2) the Fed is considering placing caps on Treasury Yields (YCC). Incidentally, both statements made it into two different articles on the WSJ on the same day. If you are like us, you would wonder why the Fed wants to place restrictions on already low yields. To understand why the Fed is contemplating actions to flatten the yield curve, we need to delve deeper into what causes yields to rise and fall and how this can impact the economy.
What does the data say? Let’s start by looking at the yield curves for Jan 2, 2020 and July 21, 2020 as shown in fig 1. There are 2 main observations that we can draw from the attached graph. The first striking fact is that there has been a downward shift of the yield curve over the last 6 months which directly implies that the yields of all the bonds are now lower than they were at the beginning of the year. This could be explained by the increased uncertainty in the economy owing to various reasons including but not exclusive to the spread of the coronavirus, the trade war with China, protests due to Black Lives Matter and increased political uncertainty due to the upcoming elections. And generally, in periods of uncertainty, investors will look for safer bonds to invest in, thus increasing the demand for government bonds. This increased demand would subsequently increase the bond price/decrease yields.
But perhaps what is more interesting is that the downward shift of the yield curve has not been uniform. A second observation can be made that the yield curve is now steeper than before, particularly the part of the curve corresponding to the longer maturities. In other words, the spread or difference in the yields for long-term and short-term bonds is now larger. Now why would that be? One simple explanation can be found in surveys regarding the expected economic outlook. Even though the forecasts for 2021 are positive with expectation of lower risk and relatively large scale economic expansion, the forecasts for 2020 remain dismal. (Trump clearly disagrees - see his tweets below- but the yield curve suggests more people share the Fed’s beliefs than Trumps’). Thus, the increased uncertainty in the long-term economic outlook has steepened the yield curve (as evidenced in the figure below, the yield curve had steepened during the inter-meeting period from April 30 to June 8, 2020).

Figure 2: US Yield curves for bonds of different maturities on April 29, 2020 and June 10, 2020, an inter-meeting period. Source: Treasury, US Government

Why flatten the yield curve?
So far we have laid emphasis on the impact of expectations on the yield curve. The yield curve control (YCC) policy, in effect, is trying to manage these future expectations of investors.
What is the Fed’s Monetary policy? In tandem with the current pandemic scenario, the Federal Reserve has been heavily purchasing assets, mainly treasury bonds, agency backed mortgage security (also managed by the US government) and foreign exchange swaps. In other words, the Fed has been heavily injecting cash into the economy and particularly lending it directly to the US Government. The balance sheet today exceeds $7 trillion compared to the post 2008 crisis levels of $3 trillion, exemplifying the new era of monetary policy.
In the pre-financial crisis (2008) era, the Federal Reserve conducted monetary policy by buying and selling short term treasury securities in the open market (also known as Open Market Operations- OMO) thereby affecting the interest rate (Federal Funds Rate, FFR) at which banks and other financial institutions lend to each other overnight. Today, while the FFR continues to be the target, the Fed directly intervenes in the market by purchasing and selling the assets, in addition to the short-term securities, on its balance sheet. Thus, affecting the FFR not through the quantity of reserves, but by choosing the interest that the Fed pays on excess reserves (IOER) to the banks and financial institutions. The objective for the Fed has always been to use all the tools at its disposal as a means to an end. The end being obtaining maximum employment and stable prices in the economy.
Another tool, the Fed began using post the 2008 crisis was engaging in large-scale asset purchases (LSAPs) which just like the name sounds, literally meant that the Fed purchased large quantities of assets thereby expanding their balance sheet way beyond historical levels, shocking the authorities and investors alike. Another frequently heard of policy tool in recent years is forward guidance’ which in the simplest terms is an effort by the central bank to influence market expectations about the future interest rates. In other words, forward guidance is the Fed’s way of influencing the shape and slope of the yield curve by communicating their forecasts and future monetary policy plans to the market.
The central bank has been actively using these tools to keep the short-term rates at a lower level. Due to the current recession, they need to keep the rates at a lower level for a longer than expected time period. So, in order to send a stronger signal to the market about its commitment to keep the rates low, they might use the YCC to support forward guidance. Even though the FFR is effectively at the zero level, the YCC should prevent any premature change in the market expectations.
The first time the Fed used this policy was during World War II when they capped the borrowing cost of the Treasury in order to facilitate war time expenditure. Another reason why flattening of the yield curve is desirable is to encourage long-term firm investment, which is essential for the economy to reboot itself. So far regarding the optimal YCC policy, the Fed’s analysis recommends placing yield caps on the short-to-medium part of the yield curve, if and when necessary.
This would essentially serve to flatten the yield curve by affecting investor’s expectations and thus facilitate higher public and private investment, thereby kickstarting the economy. (We don’t discuss the effects of the YCC on the expectations of short-term bonds here, but if caps are placed on long term bonds then the expected yield on future short-term rates will also be low. This is because no one would want to hold long-term bonds, choosing instead to constantly hold the more rewarding short-term bonds. This can be seen in the futures market where demand for future short-term bonds could be high.)
The US is not the only country concerning itself with the YCC. The Bank of Japan, since 2016, has targeted the 10-year yield while the Reserve Bank of Australia has been targeting the 3-year yield since March 2020. Just like Australia, India, for that matter, has been pursuing its own version of yield curve management in support of the bank’s forward guidance with the hope that the changes in the spread would pass through to the corporate bond market.
What’s going on with India?
On December 19, 2019, the RBI announced the initiation of its own version of Operation Twist (central bank’s policy of buying long-term and selling short-term government securities) with the intent to lower long-term rates and flatten the yield curve. This was in addition to the 1.15 percentage point decrease in the repo rate undertaken by the RBI over the entire year in an effort to kickstart the already poorly performing economy. The new RBI policy is expected to decrease the long-term rates thereby enabling the revival of the Indian economy which had been crumbling even before the onset of the coronavirus pandemic.
The following graph shows the spread between 1 year and 10 year bonds in India from Jan 1, 2020 to June 29, 2020. Operation Twist which has had four auctions so far, the last one on June 29, clearly hasn’t had much impact since we can see that the premium has only increased instead of decreasing. Remember the larger the spread, the steeper the curve.
So why hasn't Operation Twist worked in India? Some believe that the frequency of the OMOs is not sufficient and there needs to be more large-scale buys and sells by the government. Another key reason appears to be that the steepening of the yield curve is mainly due to the fall in short-term yields (in contrast to the US). This may be because as the lockdown eases, firms require immediate working capital and liquidity. The demand for long term securities remain low because firms have not yet started making investment plans for the long-term.
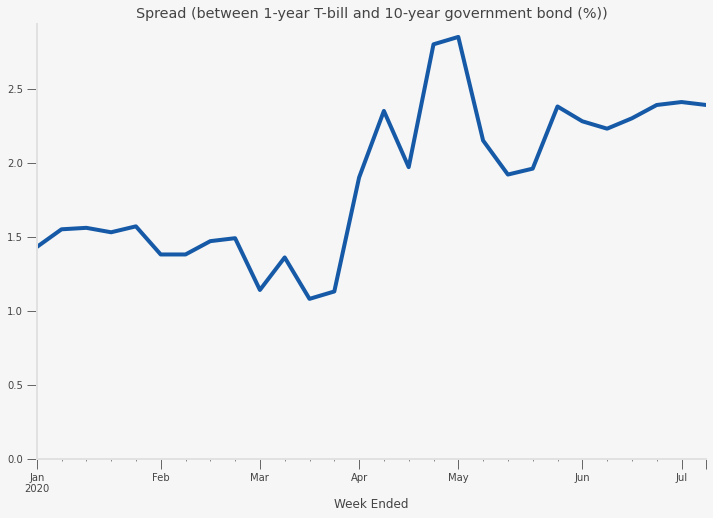
Figure 3: Spread between yield on 1-year T-bill and par yield on the 10-year (g-sec) government bond. Source: RBI, India
However, this is not to say that all is lost. By creating excess liquidity in the financial market through generic and targeted operations with other banks, the RBI in the last two weeks, has managed to bring down financing costs in the corporate bond market to a decadal low. So much so that the demand for even risky bonds (non-AAA rated entities) has increased. In the government securities market, we can see that the premium has stabilised over the last month which suggests that while the yield curve has not flattened, it hasn’t become steeper either.
In some ways, compared to the advanced economies, India is at an advantage because RBI still has room to lower the policy rate. We are not yet at the zero lower bound and conventional monetary policy via slashing repo rates still has a role to play. Moreover, the challenge with YCC has always been that it could distort market signals. Even the Fed was concerned that by manipulating the yield curve, the Fed may lose its autonomy from the US government.
Especially given that the budget deficit has been expanding, with a direct promise to cap yields, the central bank is sending a message to the markets that it will lend as much as necessary to the government which to some can be seen as a sign that the central bank is no longer autonomous.Essentially, direct YCC is a tool that is being used by countries with zero or negative rates who have no other policy tools left in their toolkit. In India, where the RBI has been active in pursuing conventional repo operations and unconventional policies such as Operation Twist, investors foresee that the RBI has no necessity yet for turning towards direct yield caps.
Very informative. Keep up the good work.
Superb, keep coming more.