


Inflation in the lockdown?

The tyranny of COVID-19 has brought both the developing and advanced nations on their knees. The federal agencies across the globe have not only been dealing with the health crisis but also the economic crisis triggered in the wake of COVID-19 induced lockdown of the world economy. Tomatoes and potatoes have become significantly more expensive than they used to be three months ago, while onions have become cheaper in the same period in India. Tea had become incredibly cheap due to a loss in international consumers as a consequence of the travel restrictions, but recent torrential downpour in Assam has caused the price of tea to increase once more. While gold prices have gone through the roof, the rental prices of luxury apartments in cities like Mumbai have decreased by approximately 20 percent.
If you were observant, then you might have noticed two distinct patterns of change over this time period - the stark changes in prices and your purchasing habits. The first phenomenon, also known as inflation, is typically defined as change in the general price level, measured by the cost of an average consumer’s basket while the second phenomenon corresponds to changes in the composition of the consumer basket.
What’s in the consumer’s basket?
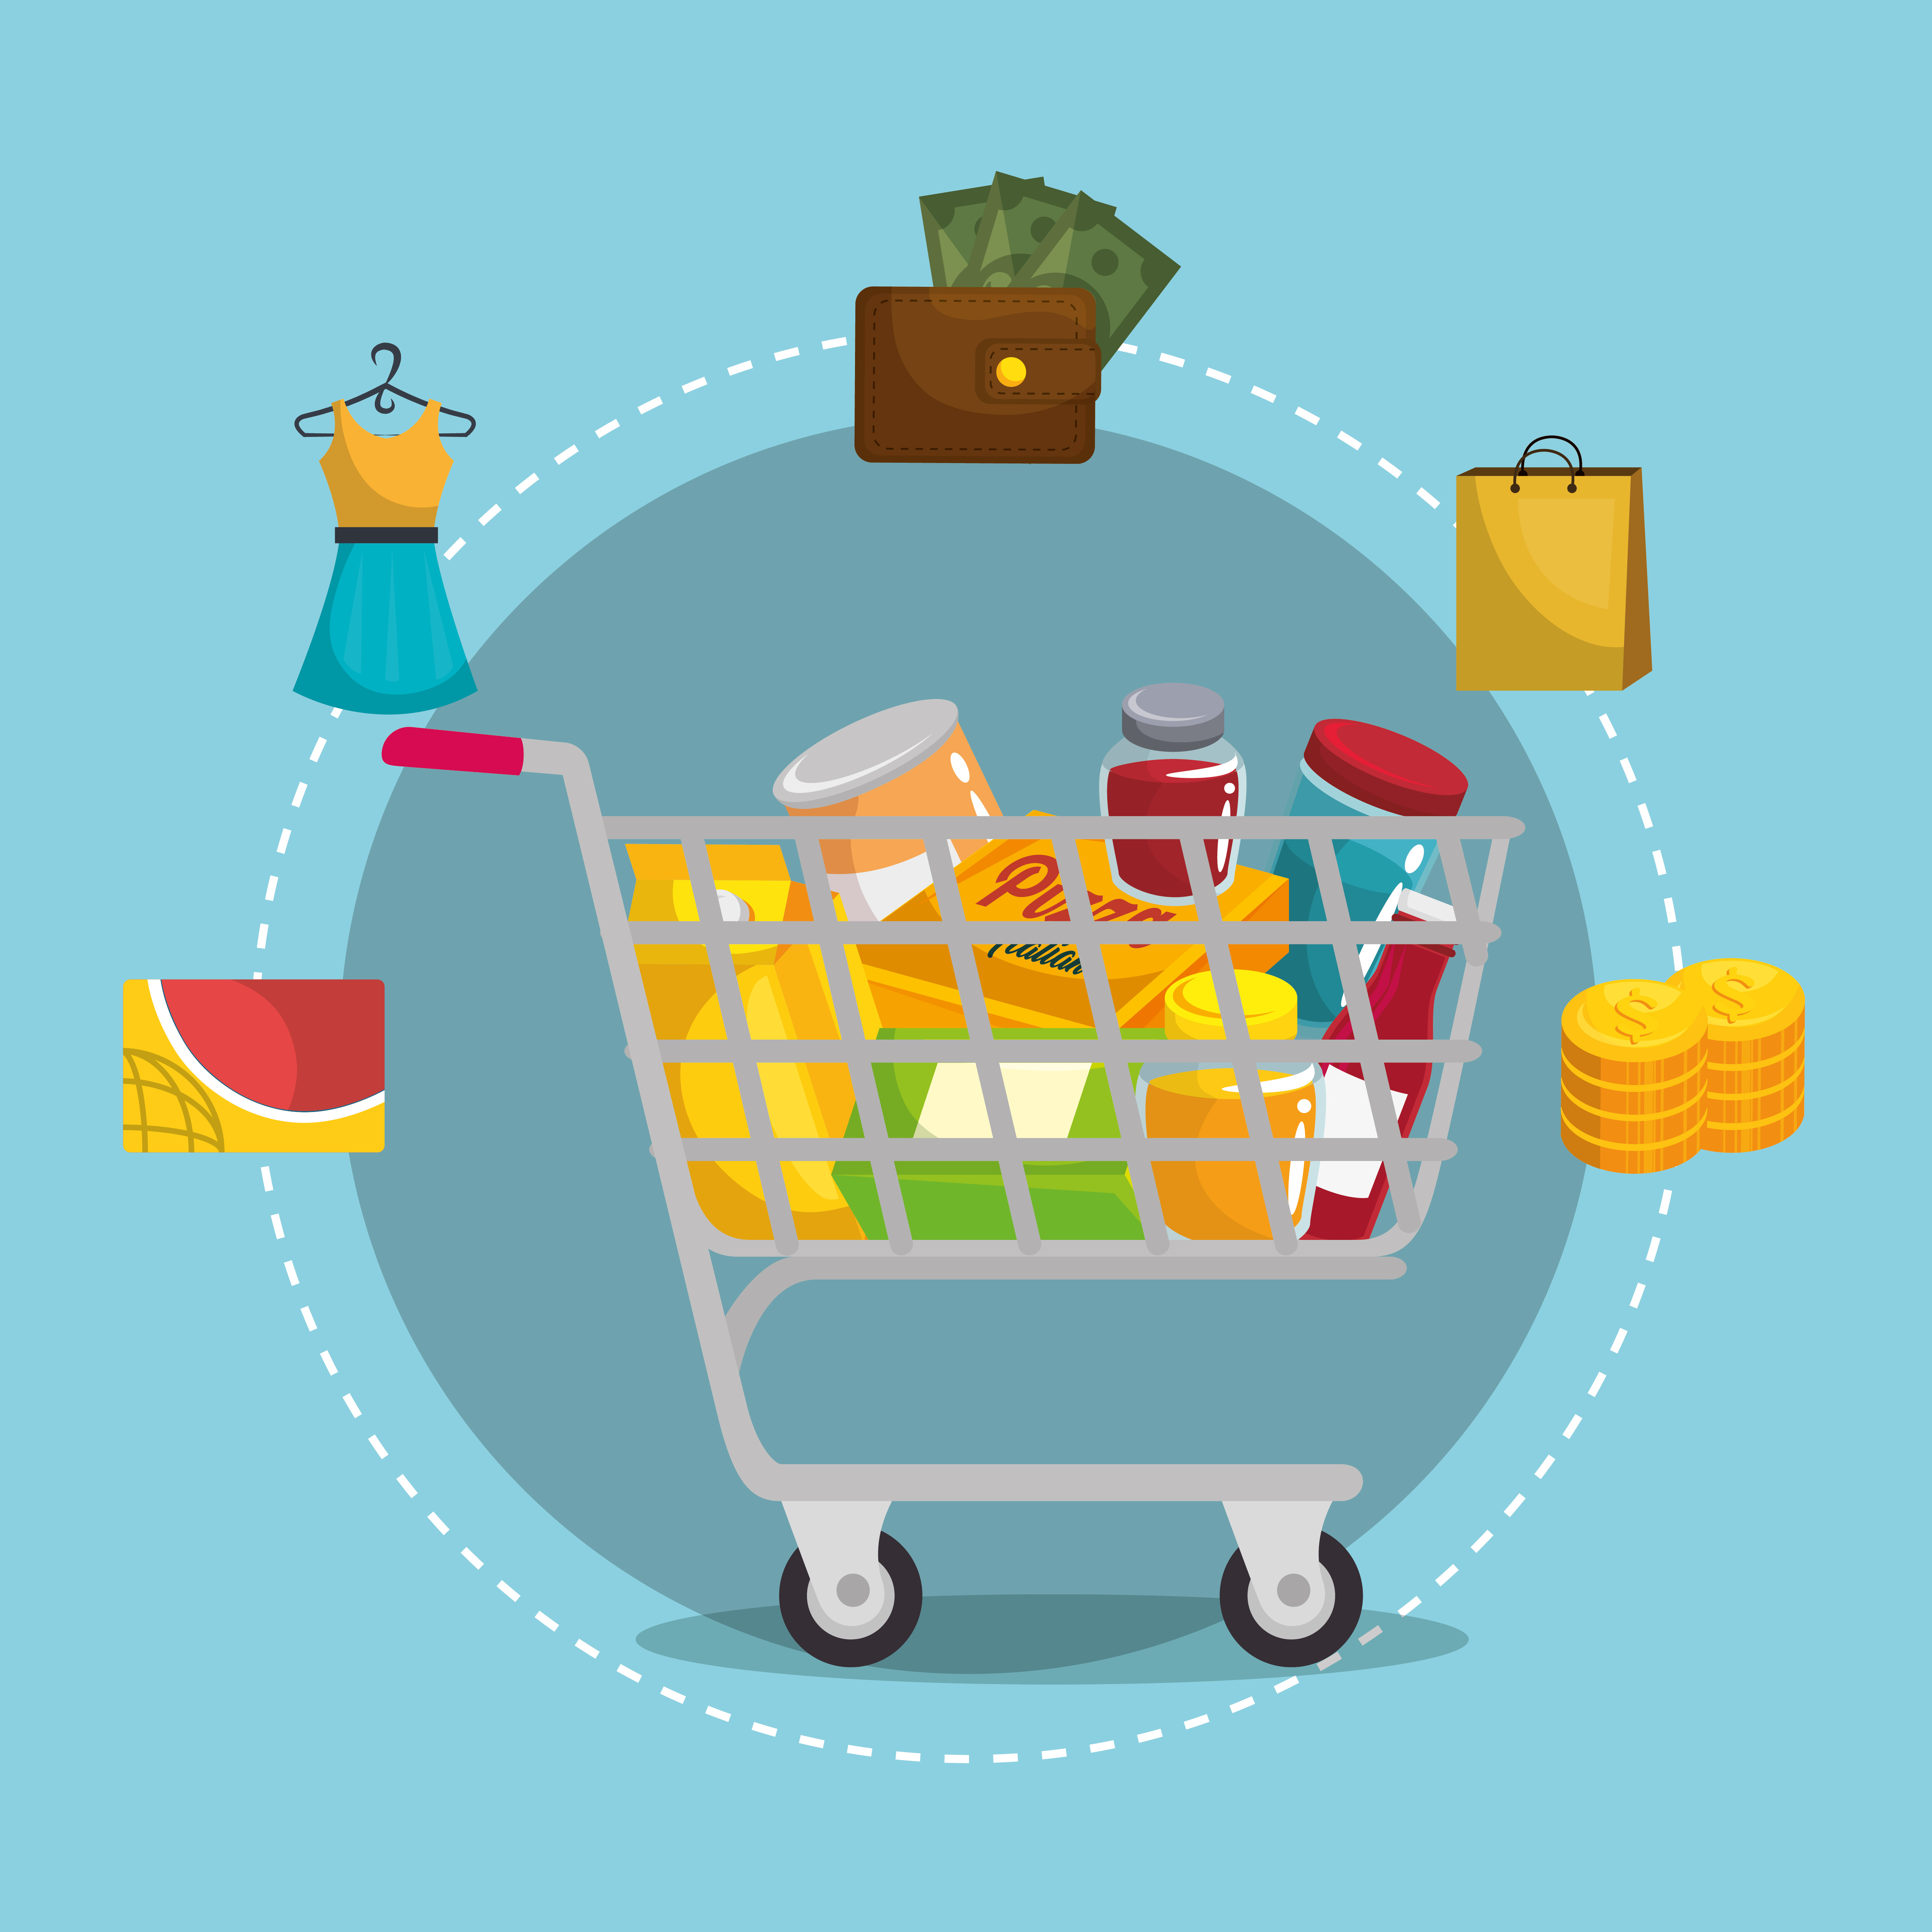
A consumer basket can be interpreted as a fixed list of items which would be consumed by an average person. This includes food, beverages, housing expenses, recreational costs among others. When a weighted average of the price of these items increases, there is said to be inflation in the economy. However, we are fairly certain that no two people in the world consume the exact same goods and services. Even if you were twins growing up in the same environment with the exact same tastes, we bet at least one of you has snuck an extra snicker into your pocket. While it is true that not everyone consumes the same goods and services, the consumer basket is meant to be representative of an average person’s consumption. So who decides what goods and services should be included in a consumer basket?

Figure 1: Consumer basket categories- combined weights. Click here for the dynamic chart with the subcategories. Source: MOSPI, India
In India, the data on the composition and prices of an average consumer basket is collected by survey correspondents who are the foot soldiers of the Ministry of Statistics and Programme Implementation (MOSPI). For ‘All India Consumer Price indices’, they collect data separately for both rural and urban areas under 6 main categories which are listed in the table below.
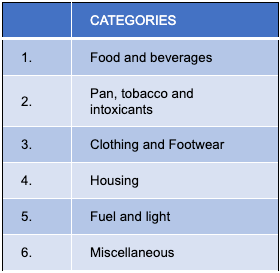
Figure 2: Composition of the Indian Consumer basket into the six main categories. Source: MOSPI, India
The weights for rural and urban areas are then averaged (based on the population) to obtain the combined weights for an average Indian across each category.
Lockdown woes
Due to the supply chain disturbances during the pandemic, the government authorities have had a tough time in calculating the inflation rate. The official document released regarding the CPI in April 2020 had no data on prices of the items in categories 2, 3 and 6. Noticeably, items in these categories were also those that were unlikely to be in high demand as they are not considered essential for human survival.
For instance, with malls and shops shut and amazon services limited to essentials, almost no one was purchasing clothes during this time. Likewise, there were no travel or recreational activities. Understanding this, the MOSPI released an updated table for April and May on June 13, 2020 wherein they used past prices to impute the price levels of missing items. While this system is not perfect, it at least attempts to address the issue of change in the general price level.
The real issue in our opinion, however, is that the weights assigned to these items have not been altered. Does it make sense to assign clothing and footwear a weight of 6.53% (which was the usual weight assigned to it during normal times) when it is a fact that very few consumers would have been able to purchase these goods during April and May 2020?
It should also be noted that the weights of the consumer basket are not altered frequently since the methodology behind it is arduous and detailed. But this is a major concern during this pandemic, since qualitative research indicates that the purchasing patterns during the lockdown look very different from the pre-COVID era.
Even though it is hard to render guesses on the possible purchasing pattern of consumers in India right now, it is worthwhile to comment that the inflation rate for every group in the basket except housing has gone up compared to the year before and the increase for some groups such as food and beverages is significantly higher. This also happens to be the group that during normal times has a 45% share of the consumer basket. It would be prudent to assume that this percentage was much higher during the lockdown, essentially implying that the actual inflation rates were also much higher than declared.
What if scenarios!
To really see this, we played around a little bit with the data from MOSPI website. The official inflation rate in March was 5.84% which increased dramatically to 7.22% in April before settling at 6.09% in June. Case 1 assumes a zero weight to categories 2, 3 and 6 while case 2 assumes that the weight to food and beverages is increased to 65% from 45% and the weight to items in categories 2, 3 and 6 are exactly halved. In both these cases, as can be seen in the figure below, changes to the weights substantially increase the inflation measure in every period.
In addition to this, the pattern of change in consumption is also relevant. According to the official figures, inflation has gone down by 1.13 percentage points in June while case 1 and case 2 suggest that the change is closer to 1.6 percentage points. No doubt, in both the cases illustrated above inflation remains above its 4-6% medium target and therefore needs to be closely watched.
What if the food and beverages category only had a 30% weight in the food basket? This case 3, would then result in contrary observations and thus, policy implications. This could be true when we consider the case that most restaurants and sweetmeat shops have been predominantly closed during the lockdown. Resultantly, the inflation rates would be much lower and the measure for June 2020 would be significantly lower than the 6%, the announced official figure. This would imply that there really is no need for the RBI to panic.
Figure 3: Inflation rates from March to June 2020, real and estimated under the three cases described in the text. Source of data: MOSPI, India; Author’s calculation
But why should inflation matter?
But why should one care whether there is inflation in the economy or not? Moderate level of inflation rate encourages spending today since you would rather purchase the goods or services before they become more expensive. Instead, if there were deflation or negative inflation in the economy, any rational person would wait and prefer purchasing in the future when the goods are cheaper. Deflation is dangerous, since it could adversely affect businesses as there would be no immediate demand for any of their products. In an extreme case, lack of demand could result in no economic activity and firms which are unable to break even (cover their costs), might have to lay off workers potentially resulting in an economic recession.
On the other hand, inflation in the double digits can also become incredibly problematic and if inflation keeps rising, it could result in a situation known as hyperinflation where the increase in prices is more than 50%. High inflation discourages growth in the long run. It results in people mass purchasing goods since the value of the currency is constantly losing money. The erosion of the value of money essentially implies that the purchasing power of the consumer is decreasing over time.
With hyperinflation, the situation is even more dire since people’s life savings could disappear overnight resulting in panic buying and supermarkets getting sold out. This could result in starvation and high levels of poverty over time. Moreover, this could have some dreadful implications for the country vis-a-vis other countries since the currency would lose value in the foreign exchange market. If you don’t believe me, ask anyone from Argentina or Zimbabwe and they would tell you all about it.
What’s the big deal if the numbers are wrong?
So should we be worried about a dire situation such as hyperinflation? Unlikely, because our central bank is carefully monitoring the situation. In fact, the Monetary Policy Committee (MPC) of the RBI, in their latest meeting on August 6, 2020 decided not to cut interest rates beyond the 115 basis points that they have decreased since the beginning of the year. Even though interest rate cuts would aid in spurring the growth of the economy, the decision to keep rates as they were at 4 percent was based on the fear that headline inflation will continue rising beyond the 6.09 percent that it was in June.
As lockdown eases and the economy is starting to slowly revive itself once more, decisions such as these can have a large impact on future economic progress. If the MPC was indeed correct about inflationary pressures, a rate cut could have caused significant damage to the economy as well. This is where simple things such as the constitution of a consumer basket could have significant effects on an economy. In the first 2 cases in the previous section, we always assume a significant weight on the category ‘food and beverages’ which has high prices today. If this remains true, then the MPC’s fear about high headline inflation in the coming months is valid.
However, if the MPC was wrong about its decision, this could severely slow down the revival of the economy, causing more hardship. Let me expand on the case 3 scenario: suppose in the future, as things go back to normal, the weight on food and beverages decreases beyond normal (especially if people had engaged in hoarding behaviour during the lockdown). Moreover, given that the pandemic has disturbed supply chain distributions, the inflation is predominantly due to these supply constraints (cost-push) which should start dissipating now with the easing of the lockdown restrictions. If the above predictions are correct, then inflation may well be within the 4-6 % range in the next few months. Then, perhaps a rate cut would have been beneficial because in any real sense it wasn’t too high to begin with!
Will face masks be the fad next year?
The problem stems from the issue that no one really knows whether these changes in consumption pattern is temporary or permanent. The current weights on the consumer basket may have been true for January 2020 and while we know for a fact that it was untrue for June 2020, it is incredibly difficult to ascertain whether it will hold true for January 2021. If a vaccine is discovered and things go back to the way they were before, will face masks still be popular?
While identifying the change in consumption seems like an arduous and impossible task, availability of improved technology for better quality data collection and new digital software for surveying could be the secret weapon we are currently missing. By helping us accurately and swiftly identify the permanence of the shifts in pattern, this may be the necessary pivot that is necessary to more precisely measure inflation and improve essential macroeconomic policy decisions.
This is an interesting note/letter on inflation and how we measure it. I have long been suspicious of government published inflation measures and the connected explanation of policy measures and the subsequent actions of the business world. Before I make my comments and perhaps expose my naiveté of the subject, I would like to declare that I am not an ‘economist’ and never want to be one. First of all, I am pleased that you addressed the fallacy of one measure fits all when it comes to inflation. This is true even in the US where my experience and thoughts have been shaped and formed for over 40 years now. Inflation is different for different sections of the population. Inflation of goods and services that a common man in the lower economic strata (earning power and wealth) sees and experiences are very different than those is higher rungs. As a percentage of earning power inflation has much nastier effect in the bottom groups. Broad based inflation measure drive certain actions such as income increase, which often doesn’t cover the actual cost of living increases. This further exacerbates income disparity and wealth accumulation, which has been growing since the 70s with no sign of abatement. India seems to be exhibiting the same pattern. Perhaps, the broad based inflation measure should further split and weighted on multiple parameters including income. I would love to see smart people like yourself will look into this further. I would like to hear if work along these lines has been done in the past. Best,.. S. Bette (sbette@gmail.com)